
Stats and Reports
This section shows how much you sold in a Jalali month or a period you choose, which gateway and which province the money came from, and which products sold the most. The report is read only from WooCommerce orders and changes no order.
Where is it? Farin → Tools → Stats and Reports
Choosing a period
All three tabs have the same bar at the top. The name of the current period (for example “Aban 1405”) is written at the top of the bar and under it is when the numbers were read.
| Option | What it shows |
|---|---|
| This month | The current Jalali month, from the first day at 00:00 to the end of the last day. When you open the section, this period is shown. |
| Last month | The whole previous Jalali month. In Farvardin, it is the previous year's Esfand. |
| 7 days | The last seven days, including today. |
| 30 days | The last thirty days, including today. |
| This year | The current Jalali year, from the first of Farvardin. |
| Month and year, and the “Show” button | Any Jalali month you like. The list of years runs from the year of the shop's first order to this year. |
| Refresh | Reads the numbers from the orders again right now. |
All periods are calculated in the site's own time zone (the one in WordPress “Settings → General”). If you change tabs, the selected period comes with you.
Comparison with the previous period
Beside most numbers is a percentage comparing that number with the previous period. Green means good news and red means bad news; for “Refunds”, a decrease is good news. The previous period is determined like this:
- This month, last month or a custom month: The whole Jalali month before it.
- 7 days and 30 days: The same number of days, right before the period.
- This year: The whole previous Jalali year.
If the previous period has no number, no percentage is shown. In that case, above the sales chart it says that period had no sales and there is no comparison.
Why the numbers are a few minutes behind
Reading a busy month's orders is heavy on the server. So each period's numbers are kept for 10 minutes, and under the period name it says how many minutes ago they were read. If an order has just arrived and you want to see it in the report right away, press “Refresh”.
Which orders are counted
- Sales: Only orders WooCommerce considers paid, that is, with the status “Processing” and “Completed”. Orders that are “Pending payment”, “On hold”, “Canceled”, “Failed” and “Refunded” are not part of sales.
- Sales amount: The order total, the same figure the buyer paid, that is, including shipping.
- Date: Each order is counted on the day it was placed, not the day its status changed.
- Orders placed: All orders in the period with any status, except orders in the trash and drafts the buyer has not yet placed.
- Wallet top-up: An order a buyer places to top up Wallet their wallet is money that has come into the shop, but it is not a sale of goods. These orders are counted neither in sales nor in the order count; their total comes separately in the “Wallet top-up” card.
- Refunds: Each refund is counted in the period in which it was made, even if its order belongs to earlier months.
Overview
Sales, day by day
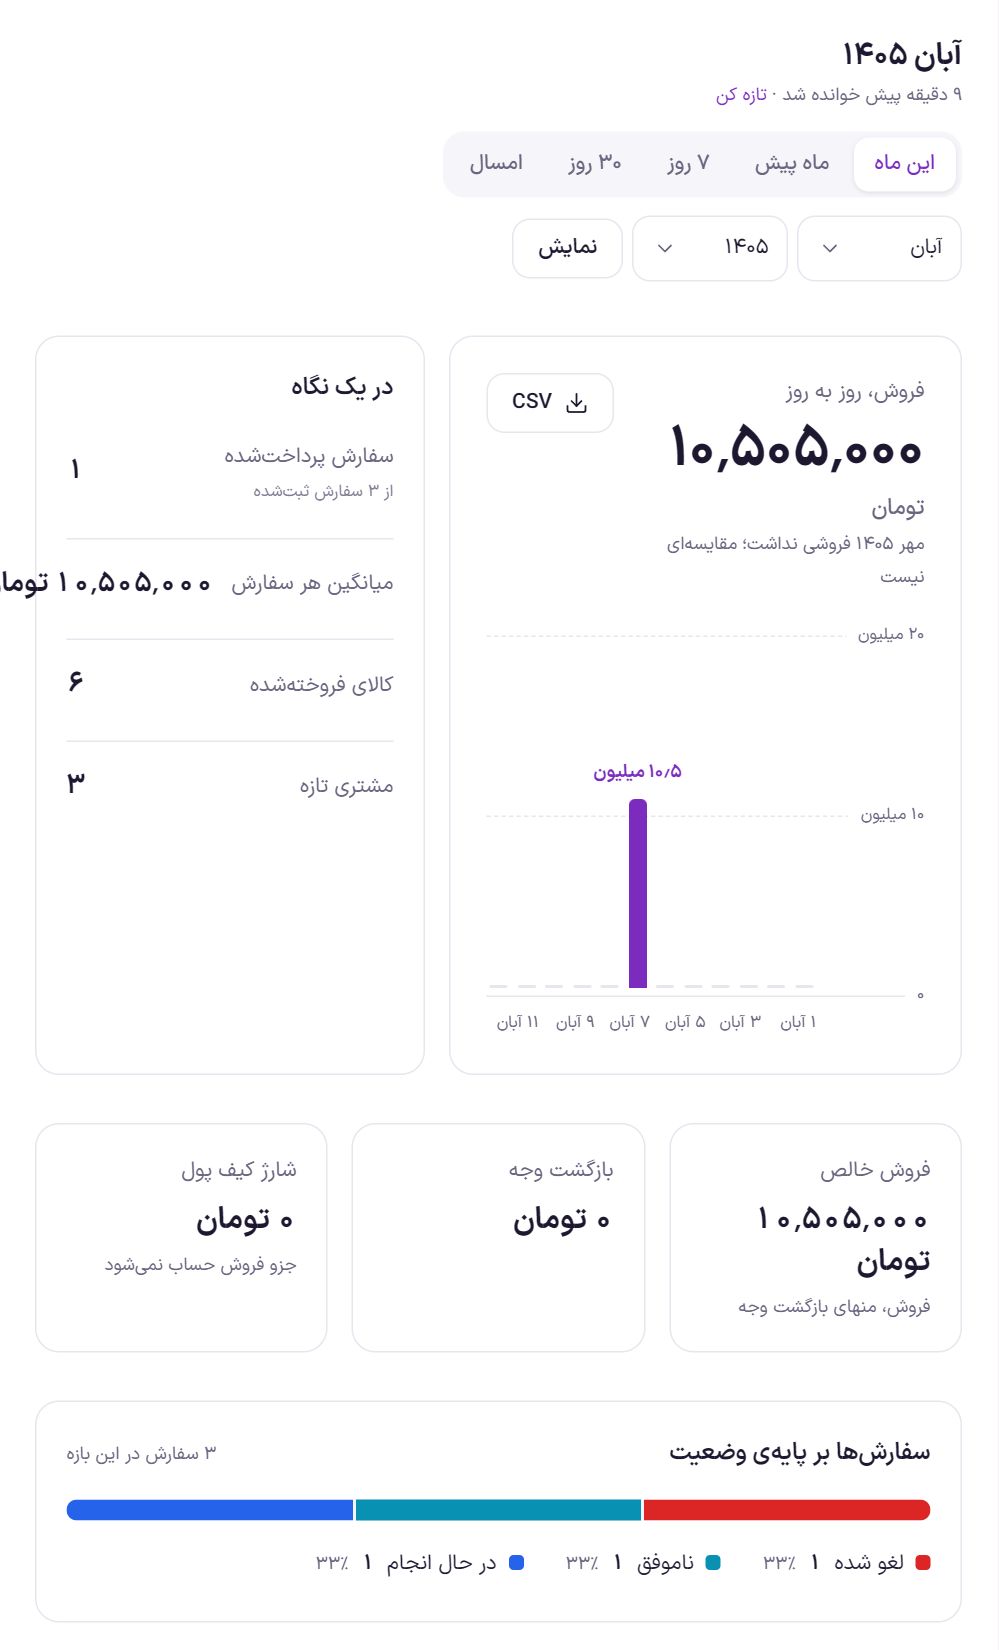
The big number above the chart is the period's total sales, and below it the percentage change against the previous period. The chart is day by day for a month and for 7 and 30 day periods, and month by month for “This year”. The first day is on the right, the way the Persian calendar is read. Days that have not arrived yet are not drawn.
The tallest bar is marked in the main color with its amount. If you move the pointer over a bar, or go to it with the Tab key, you see that day's date, sales amount and order count. If the period has no paid order, the message “There are no paid orders in this period” appears instead of the chart.
The “CSV” button gives this chart's numbers in a spreadsheet file: a row for each day (or each month in “This year”) with the columns “Day”, “Sales” and “Orders”. Amounts have no separators so Excel can add them up, and the file is saved so Excel shows Persian letters correctly.
At a glance
| Number | What it says |
|---|---|
| Paid orders | The number of paid orders in the period. Under it, it says how many of the placed orders this is. |
| Average per order | The period's sales divided by the number of paid orders. |
| Items sold | The sum of item counts in paid orders. An order with three T-shirts counts as three items. |
| New customers | The number of user accounts created on the site in this period, whether or not they bought. A guest buyer, who creates no account, is not counted. |
Net sales, refunds, wallet top-up
| Card | What it says |
|---|---|
| Net sales | The period's sales minus refunds made in the same period. |
| Refunds | The sum of the amounts you returned to buyers in this period. |
| Wallet top-up | The sum of paid wallet top-ups by buyers. This money is not counted as sales. |
Orders by status
All orders placed in the period in one colored bar that shows each status's share. Under the bar, each status's name comes with its count and percentage. At the top of the box the total of the period's orders is written. Failed and canceled orders are visible here too; if the “Failed” share is large, check the payment gateway.
Sales
This tab says where the period's money came from. All its boxes count only paid orders.
| Box | What it shows |
|---|---|
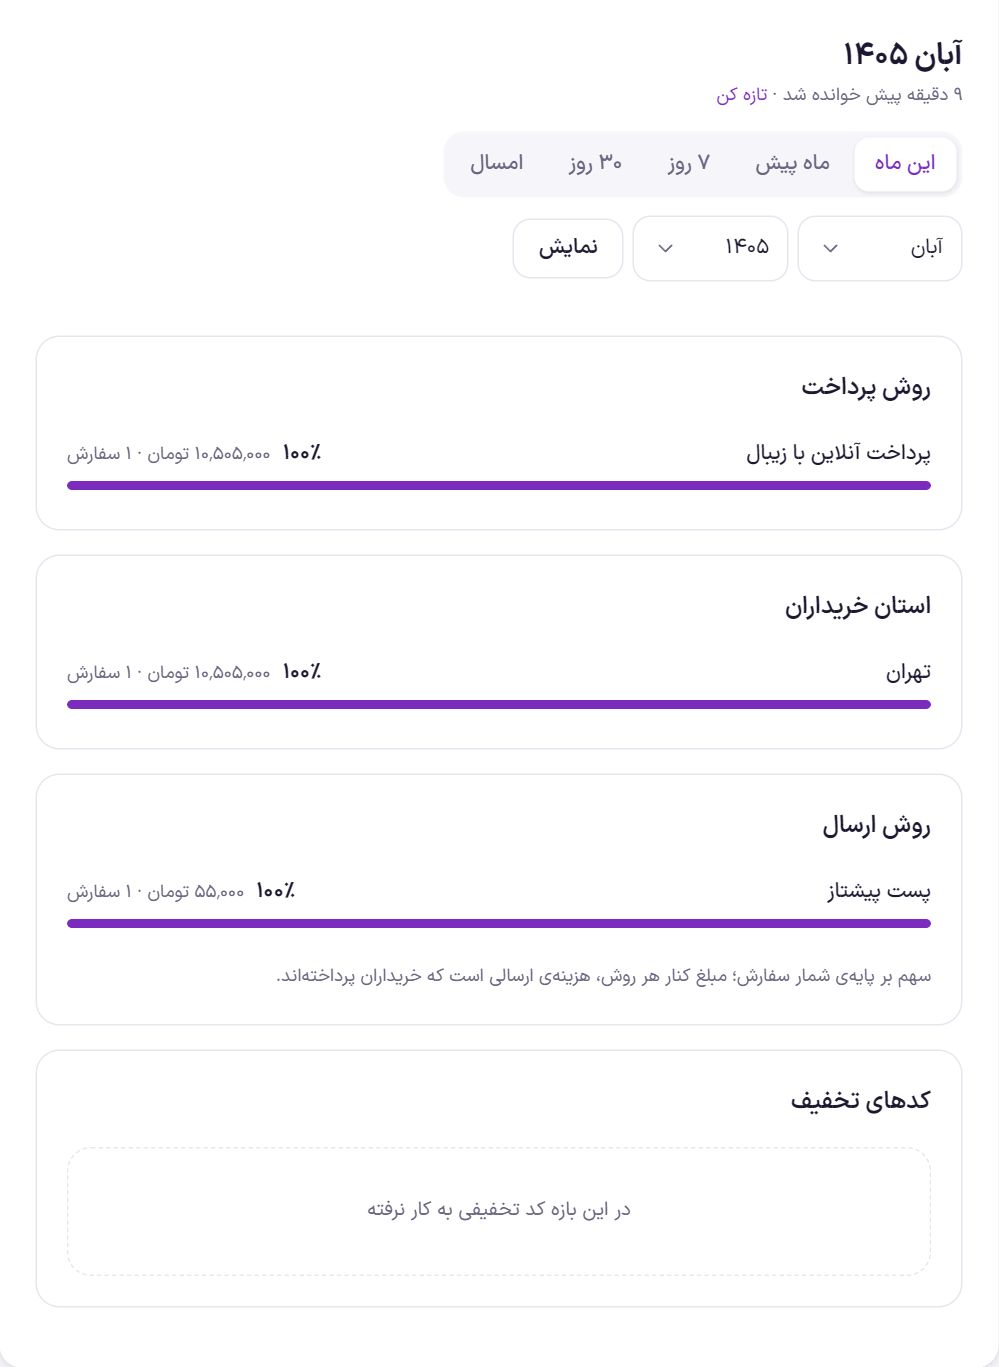
| Payment method | Each gateway's or payment method's share of the sales amount, with amount and order count. The method name is the one recorded on the order at purchase time. |
| Buyers' provinces | The ten provinces with the highest purchase amounts, based on the billing address province. An order without a province comes under “Unknown”. |
| Shipping method | Each shipping method's share of the number of orders. The amount beside each method is the shipping cost the buyers paid, not the order amount. |
| Discount codes | How many times each discount code was used and its share of all uses. The amount beside each code is the discount given with it. |
“Shipping method” and “Discount codes” each show at most the ten most used rows.
Products
Best-selling products
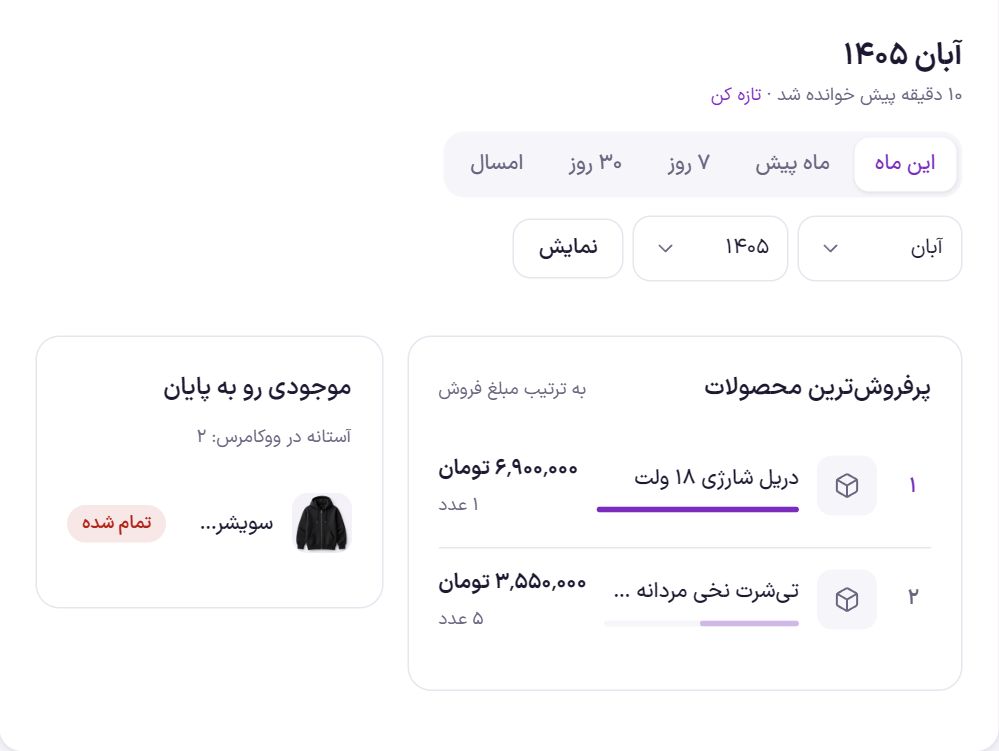
The ten products that sold the highest amount in this period, with image, amount and quantity sold. The bar under each name compares that product's sales with the first. All variations of a variable product (for example the sizes of a T-shirt) count together as one row. Each row's amount is after discount and without shipping; that is why the total of this list does not equal the sales number in the “Overview”. Clicking a product's name opens its edit page.
Low stock
This box is independent of the period and shows the situation right now . Published products with stock management on whose stock has reached WooCommerce's low-stock threshold or below, from lowest stock, up to ten rows. Beside each it says how many are left or “Sold out”.
The threshold is written at the top of the box (for example “Threshold in WooCommerce: 2”) and is read from the “Low stock threshold” setting in “WooCommerce → Settings → Products → Inventory”. To change it, change it there.
Stats in the WordPress dashboard
Farin also puts three boxes on the first page of the WordPress dashboard, built from these same numbers:
- This month's sales: Sales, paid orders, average per order and new customers for the current month against last month, with a day-by-day chart and a “Full report” link.
- Pending orders: The number of orders waiting for you (“Processing” or “On hold”) and the last five of them.
- Best sellers and stock: This month's best sellers and products whose stock is running low.
The first time each user opens the dashboard, Farin opens its own boxes, hides the other boxes (WordPress, WooCommerce, Elementor and plugins) and closes the WordPress welcome panel. This happens only once. Turn any box back on from “Screen Options” at the top of the dashboard; your choice stays.
Frequently Asked Questions
An order that was just placed is not in the report.
The numbers are kept for up to 10 minutes. Press “Refresh”. If it is still not there, look at the order status: an order that is “Pending payment” or “On hold” is counted only in “Orders by status”, not in sales.
Why does the sales number differ from WooCommerce's own reports?
Farin converts the period to a Jalali month in the site's time zone, counts only “Processing” and “Completed” orders as sales, counts the order's total amount including shipping, and separates wallet top-ups. Each of these may be calculated differently in another report.
It's the start of the month and the sales percentage is red and negative.
“This month” is compared with the whole previous month. In the first days of a month it is natural to be below the whole previous month. For a fairer comparison choose “7 days” or “30 days”, which are compared with the same number of days before them.
“New customers” is more than the number of buyers.
This number counts accounts created in the period, not buyers. Someone who only registered and has not bought anything yet is in it too.
Farin Theme · 1405