
Guides / Reports and Settings
Stats and Reports
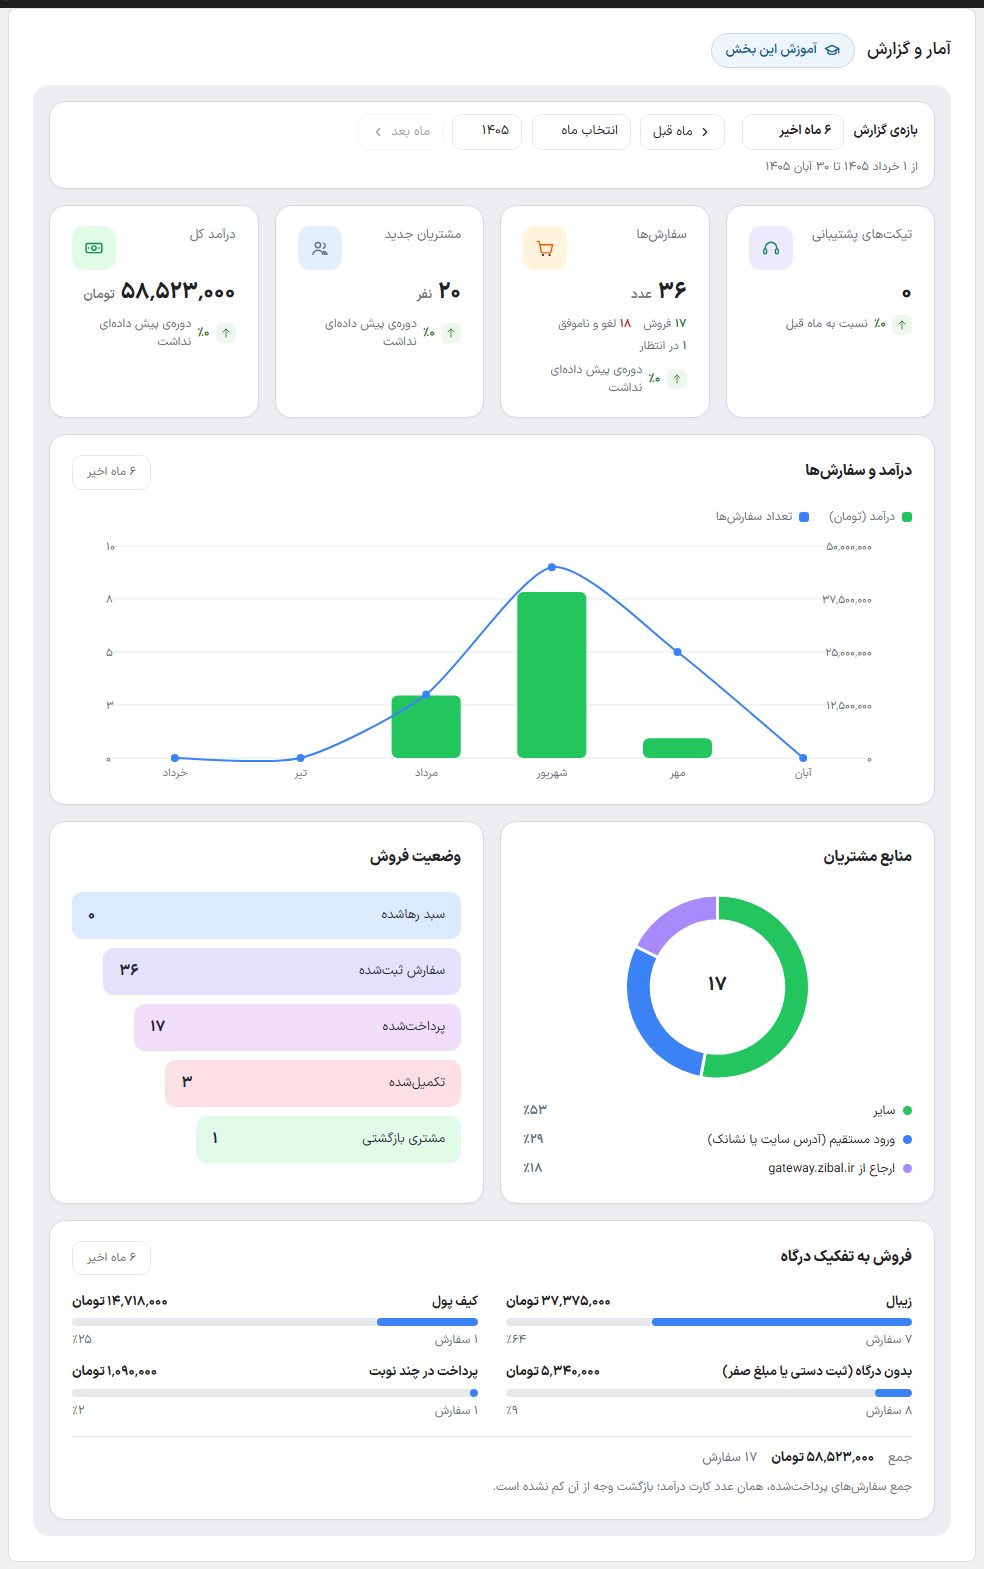
One page to see how the store is doing: revenue, orders, new customers, tickets, each gateway's sales, customers' traffic source, best-selling products and buyers' devices, over any range you want.
Where is it? Rafina Panel → Stats and Reports
Report range
| Option | What it does |
|---|---|
| Report range | “Today”, “Yesterday”, “Last 7 days”, “Last 30 days”, “This month”, “Last month”, “This year” or “Last 6 months”. All cards and tables change with it. |
| Month and year selection | Reports on any Jalali month. “Previous month” and “Next month” move by one month. The selected month stays in the page address so you can reopen the same report or send it to someone. |
Below the bar, the exact range is written in Jalali dates. The day and month boundary follows the site's own time.
Summary cards
| Card | What it shows |
|---|---|
| Support tickets | New tickets in the range. |
| Orders | Number of orders, broken down into sales, canceled and failed, and pending. |
| New customers | People who created an account in this range. Admin accounts aren't counted. |
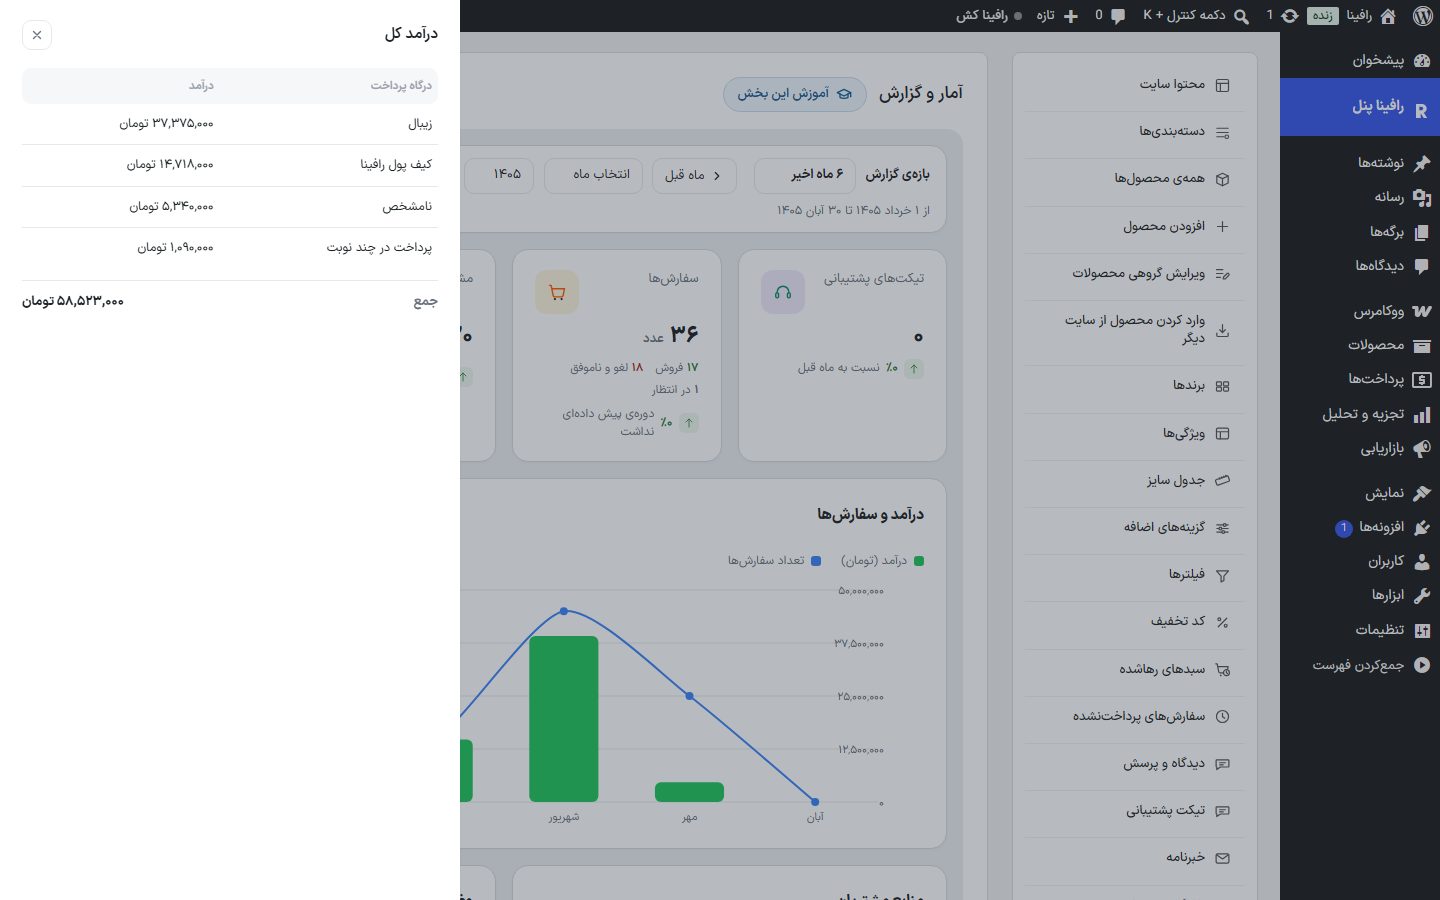
| Total revenue | Total of paid orders; refunds aren't subtracted. |
Under each card the change compared to the previous period appears with a percentage and a green or red arrow; if the previous period had no data, that is what is written. Click any card to open its details in the side drawer.
Charts
| Section | What it shows |
|---|---|
| Revenue and orders | The green column is revenue (Toman) and the blue line is each month's order count. Click a month's column to open that month's report. |
| Customer sources | Where customers came from, the same phrase recorded in the order origin note: direct entry (site address or bookmark), a referral from a site, a search engine or a campaign, with percentages. The five most frequent sources appear separately and the rest, together with orders that have no origin, are grouped under “Other”. Click any slice to open the orders of that source. |
| Sales status | A funnel from abandoned cart to placed, paid, completed order and returning customer. |
| Sales by gateway | Amount and order count for each payment gateway with each one's share, and a total that equals the revenue card's number. “No gateway” means manual entry or a zero-amount order. |
Lists
| Section | What it shows |
|---|---|
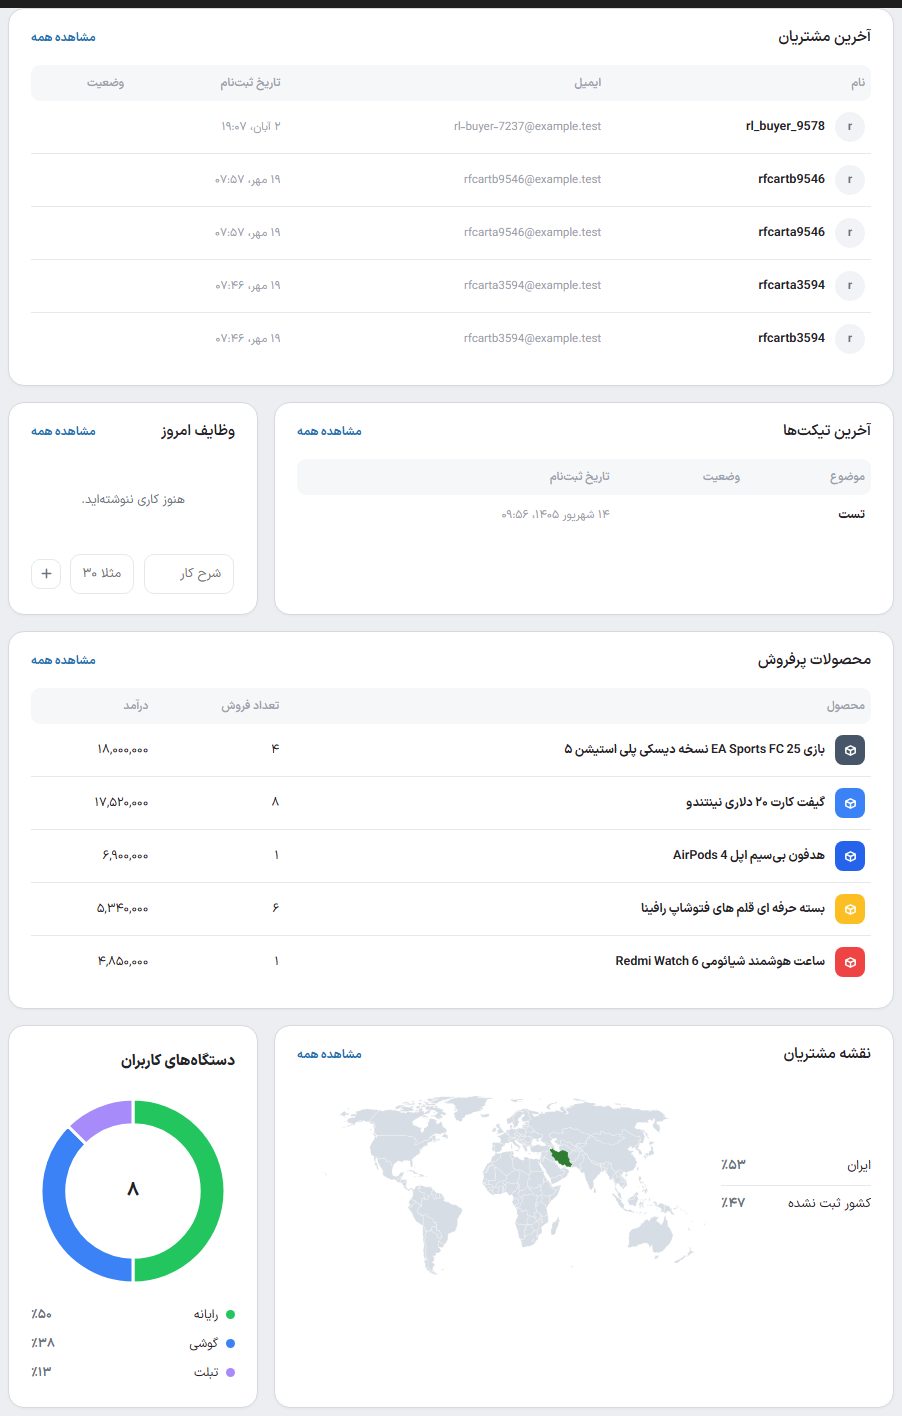
| Latest customers | Name, email, sign-up date and status. “View all” opens the full list. |
| Latest tickets | Subject, status and ticket submission date. |
| Today's tasks | Your own task notes: write the “Task description” and time and press “+”. |
| Best-selling products | Sales count and revenue of each product in the range. |
| Customer map | The country distribution of buyers. “Country not set” means orders whose billing country is empty. A long list scrolls inside the card itself. |
| User devices | The share of computers, phones and tablets in orders. |
NoteEach range's report is held for a few minutes so the page opens fast; an order placed just now may show up in the report a few minutes later.